Enhancing Operational Efficiency and Sustainability: A Case Study on 6S Implementation in a Jute Spinning Facility
Abstract
Md Mehedi Hasan Niloya*, Shoaib Islam Zicob, Rafid Ahmed Chowdhuryc, , Syed Redwanul Islamc, Mohammad Iqbala, Elias Khalild
bDepartment of Jute and Fibre Technology, University of Calcutta, Kolkata, West Bengal 700073, India
cDepartment of Industrial and Production Engineering, Shahjalal University of Science and Technology, Sylhet-3114, Bangladesh
dTangail Textile Engineering College, Tangail, Bangladesh.
*Corresponding Author [mehediniloy334010@gmail.com]
Keywords: 6S Implementation; Lean Manufacturing; Jute Industry; Operational Efficiency; Sustainable Manufacturing
Full Text
1. Introduction
Jute is one of the oldest and most natural fibers which is used in textile industry [1]. Jute is used to produce a range of goods including yarn [2]. This yarn is 100% biodegradable and recyclable and that is why there is always a huge demand of Jute Yarn in outside of Bangladesh [3]. This Jute Yarn is produced in Jute Mills or Jute facilities [4]. But these facilities’ system, culture, process is not improved as they should be. This is why this system is facing numerous challenges like poor working conditions, low productivity, lack of scientific knowledge, high amount of wastage etc. That is why it has become more important in this situation to incorporate process improvement tools or systems to Jute industry to have the best output.
Hirano introduced a new principle of 5S in 1996 where every S indicated a particular meaning. 5S means Sort, Set in order, Shine, Standardize, and Sustain [5]. This principle described the way of implementing 5S and emphasized the importance of improvement of workplace culture leads to operational excellence [6]. The Production environment can be transformed into a developed, maintained workplace by implementing 5S lean methodology [7]. Implementation of 5S tends to be labelled workspace, a safe and organized working process where audit will also be done to document work in progress and sustain better operations.
The lean 6S methodology combines Safety with 5S which makes the tool more powerful and effective lean improvement tool which can be easily used in any type of company for a better workspace. 6S, the expansion of 5S principle is also becoming popular in industrial contexts [8]. So, the six principles of 6S are Sort, Set in order, Shine, Standardize, Sustain, and Safety – promotes a strategy for workplace organization and ongoing development. It is possible now to develop, maintain and store a production work environment by 6S [9].
The implementation of 6S in Jute Yarn manufacturing industry is a step towards modernizing from backdated workspace and workplace culture. The Jute sector is vital to many sectors for providing the raw materials as Jute yarn. In this Jute yarn manufacturing industry - Process optimization, cutting waste, and improving overall performance all can be done by implementing 6S [10].
Moreover, the implementation of 6S provides an opportunity for the jute industry to adapt to modern manufacturing practices. This not only aligns the industry with current standards but also enhances its competitiveness in the global market, positioning it as a dynamic and forward-thinking player in an evolving economic landscape and the most widely used technique for raising an organization's or company's efficiency and safety is 6S. Every kind of business or industry can use the 6S technique. This technique improves any work environment's quality, decreases waste, and boosts efficiency.
The Lean 5S technique incorporates the 6S idea of safety and security [11]. The additional 6S phase goes over every aspect of a workspace and assess the risks in each and every section [12]. This allows employees to be outfitted with protective gear based on their individual characteristics and ensures the workstation's safety by closely adhering to standards for machinery use and occupational safety and health [13].
Total Quality Management is the practice of continuously improving quality control [14], and the concept of 6S is used to apply TQM at the operating level. 6S is a way of thinking that emphasizes managing and organizing the workplace through the elimination of waste and the improvement of quality and safety. The organization's workplace is made safer and more productive with the help of the 6S approach.
The 6S extension adds a critical safety component [15], while the 5S methodology offers a methodical approach to workplace excellence and management [16]. By combining these ideas with Total Quality Management, an emphasis on efficiency and organization is placed alongside the improvement of overall workplace quality and safety, signifying a dedication to continual improvements.
In a backdated industry like Jute, this 6S lean tool will improve cultural and operational system while improved efficiency, continuous improvement and long-term sustainability will be the outcome according to industrial context.
So, the main objective of 6S implementation in Jute Yarn manufacturing industry is to systematically improve the efficiency level and effectiveness of the system by organizing the workplace, optimizing the system processes, ensuring cleanliness in all sections, and having a culture of continuous improvement which will help to adapt Advance manufacturing system and tools.
2. Methodology
The 6S methodology adds one more component to the 5S approach, which is safety [17]. The 6S methodology aims to establish and preserve a well-structured, spotless, productive, and secure work environment. In any organization, it is employed to create a safer work environment. It contributes to higher customer happiness, cost savings, and high-quality achievement. All the six “S” are described below:
1. Sorting: The 6S approach starts with this stage. In this step, sort all of the material that is usable at work and dispose of the useless stuff giving a red tag. Material sorting helps to clear space on the floor.
2. Set in Order: In the 6S technique, this is phase two. To ensure proper use, arrange all materials, equipment, and tools in the workplace in a planned and optimal order in this stage. Time and resource waste are decreased by this configuration of the equipment, supplies, and tools. Material waste is decreased by using appropriate material handling techniques. This step involves everything being put in its proper position.
3. Shine: The 6S methodology's third phase is this. At work, make sure all equipment and machines are thoroughly cleaned. The floor space needs to be tidy and spotless. Both dust and oil should be removed from the equipment and machines. Thus, it is important to thoroughly and frequently clean the tools and machines.
4. Standardization: The 6S methodology's fourth stage is this. Increase employee morale and productivity by implementing standards in the workplace. The key to improved working is workplace standardization.
5. Sustain: The Six Sigma methodology's fifth step is this one. The four stages listed above should be routinely put into practice at work in this step. All steps should be regularly implemented, and this is the manager's responsibility. When the aforementioned four procedures are consistently followed at work, both worker and machine efficiency rise.
6. Safety: The sixth and most crucial phase in the process is this one. The most crucial factor in establishing a positive work environment is safety. Every safety device is installed in the workplace. Every employee should put on all safety gear before entering the office. This contributes to the improvement of the working environment at the workplace and makes it safer.
Table 1: 6S Lean Tool
|
Sort – Seiri |
Throw away all useless and waste material from the workplace |
|
Set in Order – Seiton |
Everything in their proper place for quick access |
|
Shine - Seiso |
Maintain the workplace neat and clean |
|
Standardize – Seiketsu |
Constantly keep order at workplace and make it habitual |
|
Sustain – Shitsuke |
Practice 5S daily |
|
Safety |
Use all safety equipment and maintain them in a well manner way |
2.1 6S Implementation Steps
1. Research design: The research design integrates both qualitative and quantitative data to capture a holistic understanding of the impact of 6S on various facets of the Jute spinning facility’s operations.
2. Data collection:
i. Qualitative data
a. Observations: Direct observations of the workplace before, during, and after 6S implementation has been conducted to assess changes in organization, cleanliness, and safety practices. Observational data offers real-time insights into the practical aspects of 6S application.
ii. Quantitative data
a. Performance Metrics: Key performance indicators (KPIs) related to production output, waste reduction, and safety incidents has been collected both before and after 6S implementation. These quantitative metrics enables the assessment of tangible improvements resulting from the intervention.
3. Implementation process analysis: A detailed examination of the 6S implementation process has been conducted, including the development of 6S teams, training programs, and the integration of 6S principles into daily routines. This analysis aims to identify critical success factors and potential bottlenecks in the implementation journey.
4. Efficiency and wastage calculation: In each section, the nonproductive time through the mechanical, electrical and some others issues like transportation or idle time has been calculated. Then, efficiency (%) and amount of wastage has been calculated and analyzed day wise.
5. Comparative analysis: The comparison between the pre and post 6S implementation has been shown. By this the scenario and positive insights can be easily drawn.
6. Ethical considerations: Ethical considerations, including informed consent, confidentiality, and the right to withdraw from the study, has been strictly adhered to throughout the research process. Approval from relevant ethical review boards has been obtained before commencing data collection.
By employing a mixed-methods approach, this methodology aims to capture both the qualitative and quantitative impacts of 6S implementation in a jute mill, contributing valuable insights to the existing literature on lean methodologies and organizational performance.
Both qualitative and quantitative data are collected to identify the previous and present situation inside the industry. Qualitative data is collected as photographs which will be compared to previous with present scenario after implementation of 6S.
3. Case study
3.1 Sort
Following the implementation steps, at first Sorting phase was started. Identification of unnecessary things was done as seen from figure 1(a) and 2(a) and sorting was done as seen in figure 1(b) and 2(b).


3.2 Set in order
The 2nd phase was implemented after Sorting phase. In this phase, disorders among the whole facility were identified. Then, a standard order was fixed and implemented as is observed from figure 3 to 5.


3.3 Shine
One of the most important phases is done next, which is very effective for the elimination of wastage and cleanliness. The floors remained dirty and no scheduled maintenance of the machines was performed in the previous scenario of this facility as is evident from figure 6(a). Figure 6(b) shows neat and clean facility from all perspectives.

3.4 Safety
Safety is very important for a facility and plays a vital role in the process of ensuring 6S. Hence, this step was thoroughly implemented as per industry standards and as per figure 7 and 8, many hazards inside the facility were deducted and risky objects were organized to keep a safe and sound workplace.
3.5 Standardize
This phase is implemented after the safety part. All the process, sections, working cultures, inventories were turned into a standard way as seen from figure 9 to 11 in which other S’s implementation can sustain in the long run.


3.6 Sustain
The positive outcomes of the 6S implementation in the Jute spinning facility have proven to be sustainable over the long term as because of the systematic organization, cleanliness, and standardized processes introduced through 6S have become deeply ingrained in daily operations, resulting in enduring efficiency gains. The 6S principles have seamlessly integrated into the organizational culture. Employees at all levels have embraced the new practices, recognizing the value of an organized and efficient workspace. The whole workforce is equipped with the necessary skills to adhere to and enhance 6S practices, ensuring that the benefits are perpetuated through a knowledgeable and empowered team. Rigorous monitoring and evaluation mechanisms are in place to ensure the sustained effectiveness of 6S practices.
4. Results and discussion
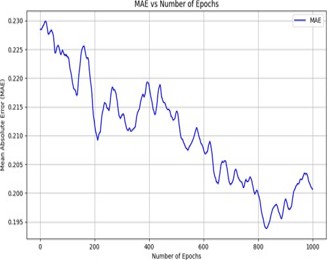
The following table 2 and table 3 shows the overall efficiency per day before and after implementing 6S. Table 4 summarizes the day wise efficiency along with their average regarding before and after implementation of 6S which is represented in a line chart as shown in figure 12.
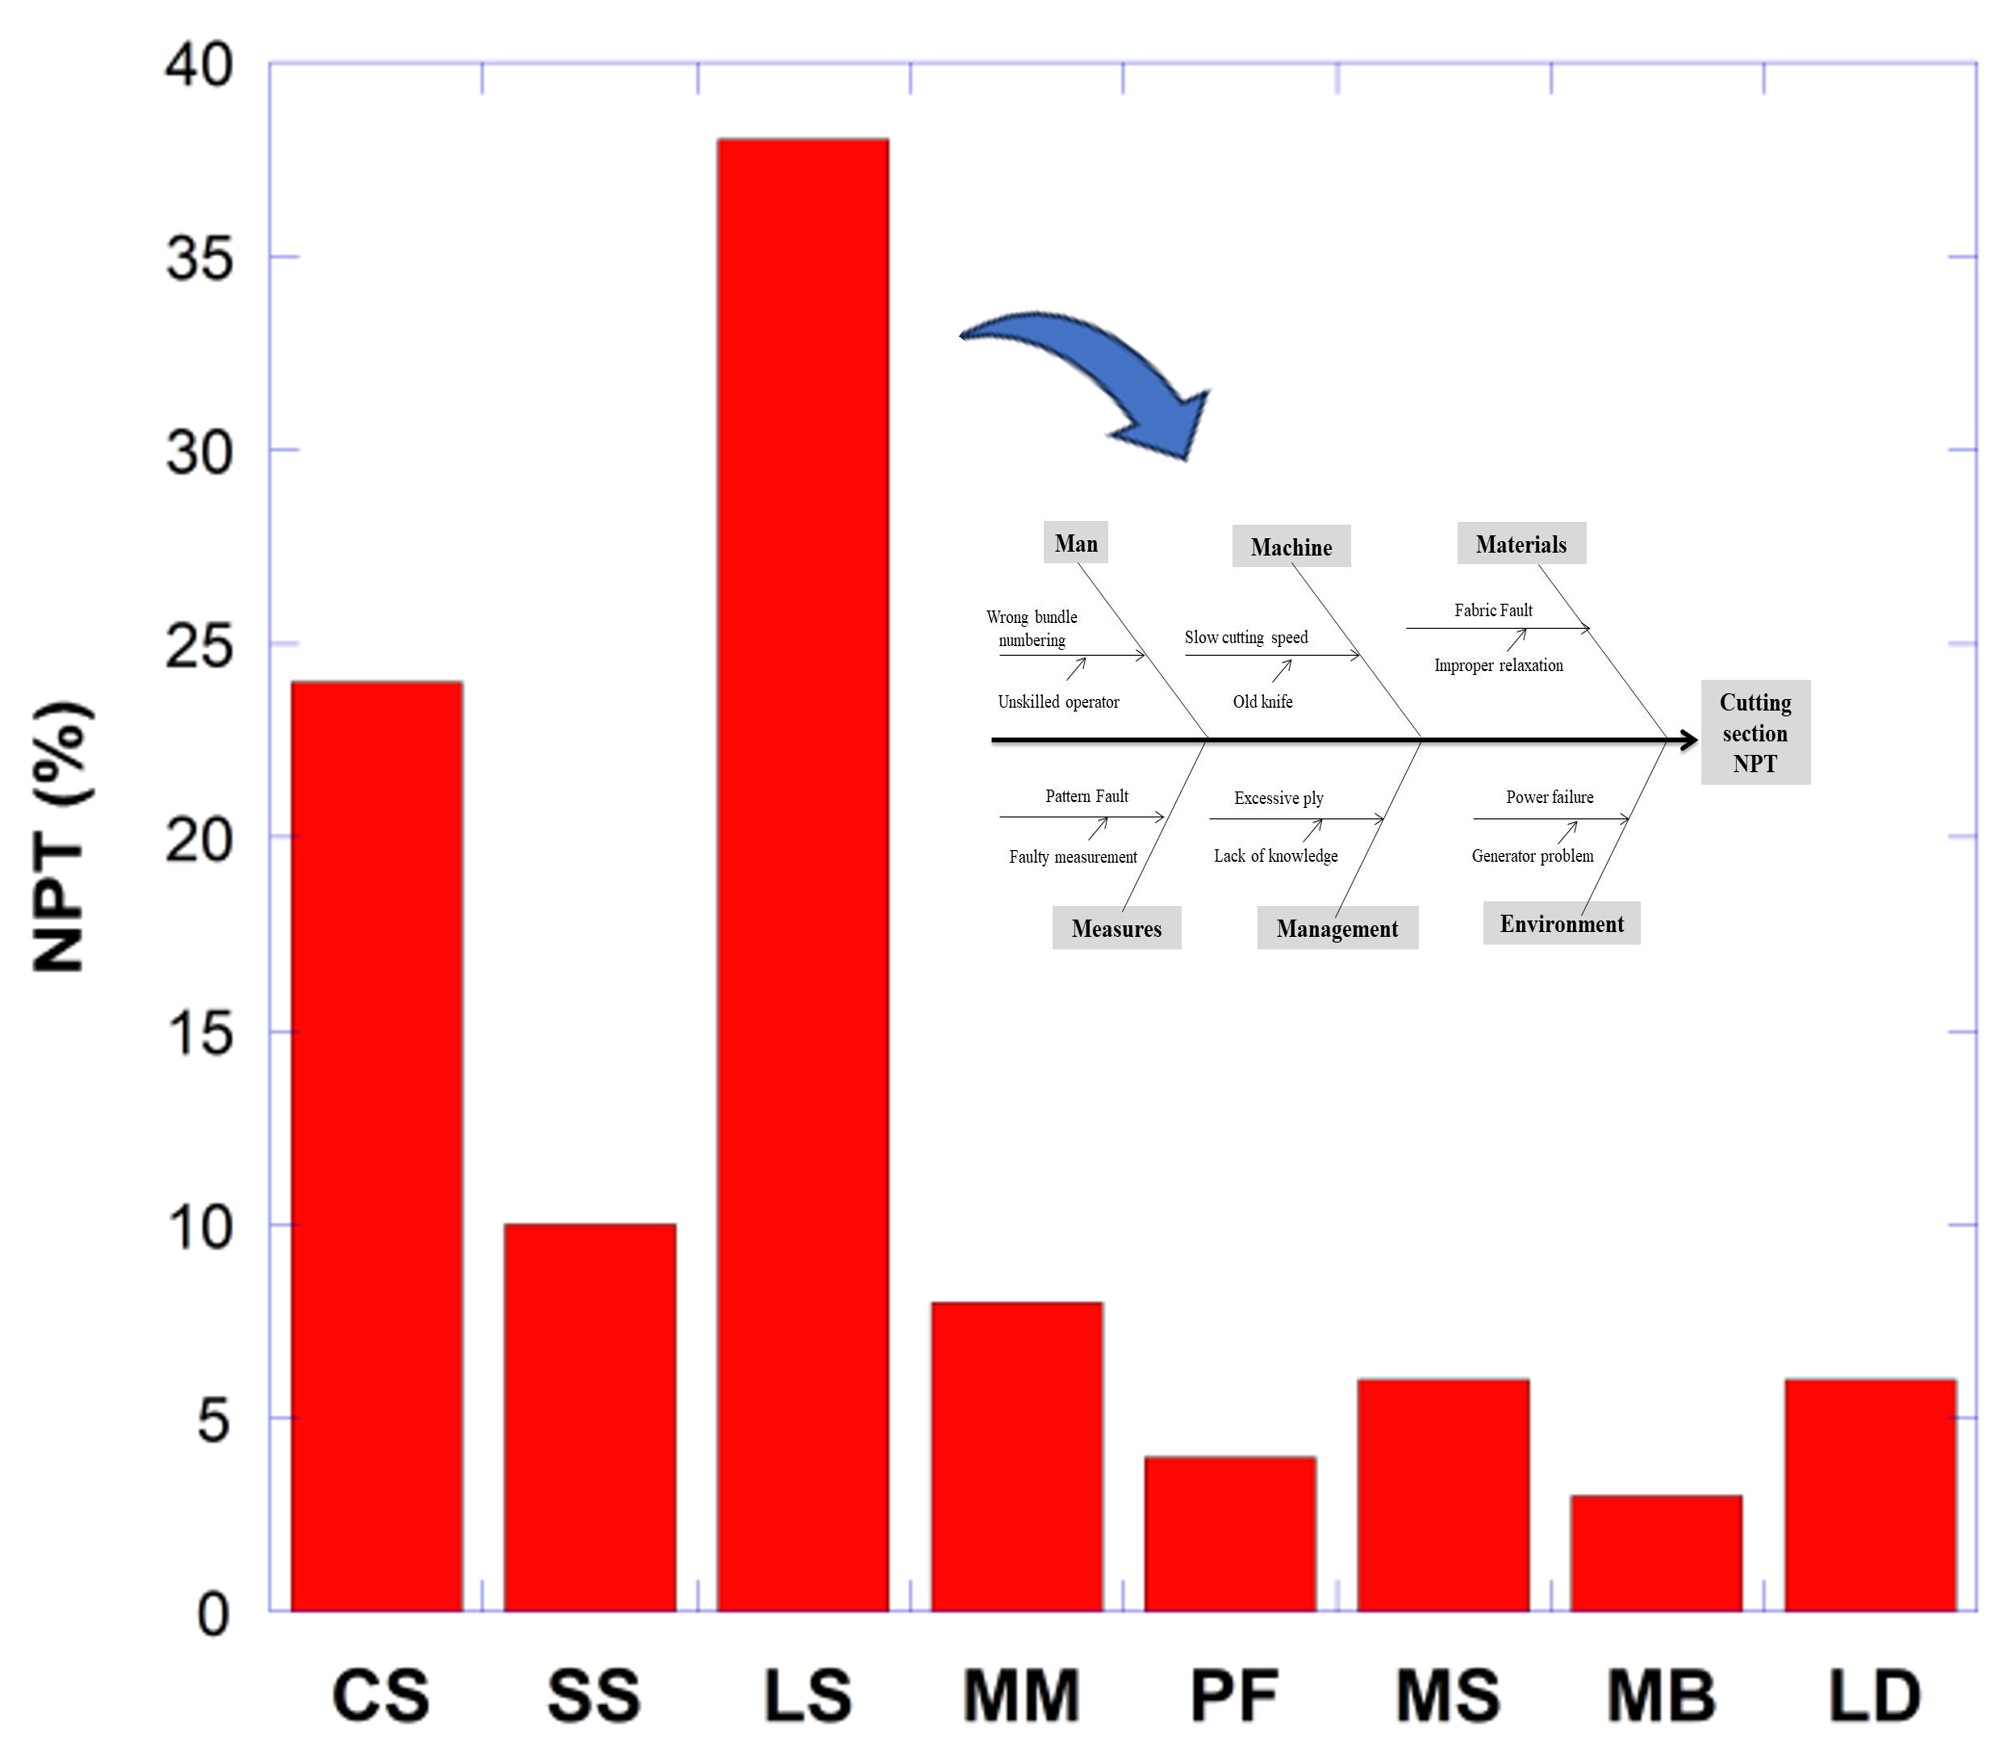
Non-productive time (NPT), primarily attributed to mechanical and electrical breakdowns, was identified as a significant contributor to productivity loss in the jute mill. Prior to implementation of 6S, frequent machine stoppages occurred due to poor housekeeping, lack of preventive maintenance, and limited accessibility to equipment and electrical panels.
The application of the 6S methodology led to a structured improvement in workplace organization and cleanliness, enabling early detection of mechanical wear and electrical faults. Standardized maintenance practices and improved safety measures further minimized unplanned downtime. Consequently, a measurable reduction in NPT was observed, resulting in improved machine availability, smoother production flow, and enhanced overall operational efficiency. The nonproductive times of Batching, Carding, Drawing, Spinning, Winding, Precision and Roll winding, Packaging and Inventory are taken by time study before the 6S implementation.

Figure 12. Fishbone (Ishikawa) diagram illustrates the root causes of non-productive time (NPT) in the jute mill. Mechanical, electrical, manpower, method, and environmental factors were found to be the major contributors to breakdown-related downtime.
Table 2: Section wise nonproductive time and overall efficiency per day before 6S implementation
|
Section |
Issue |
Non-Productive Time Throughout 24 Hours (Minutes) |
||||||
|
Day 1 |
Day 2 |
Day 3 |
Day 4 |
Day 5 |
Day 6 |
Day 7 |
||
|
Batching |
Electrical |
65 |
54 |
89 |
67 |
87 |
89 |
88 |
|
Mechanical |
354 |
447 |
226 |
376 |
381 |
570 |
378 |
|
|
Others |
49 |
98 |
60 |
123 |
90 |
121 |
113 |
|
|
Efficiency |
67.50% |
58.40% |
74.00% |
60.70% |
61.30% |
45.80% |
59.80% |
|
|
Carding |
Electrical |
45 |
56 |
59 |
98 |
77 |
77 |
85 |
|
Mechanical |
356 |
348 |
392 |
370 |
413 |
3 |
321 |
|
|
Others |
70 |
108 |
124 |
88 |
120 |
89 |
89 |
|
|
Efficiency |
67.30% |
64.40% |
60.10% |
61.40% |
57.60% |
88.30% |
65.60% |
|
|
Drawing |
Electrical |
67 |
65 |
89 |
73 |
76 |
87 |
86 |
|
Mechanical |
310 |
389 |
365 |
319 |
382 |
396 |
375 |
|
|
Others |
89 |
124 |
78 |
98 |
101 |
70 |
107 |
|
|
Efficiency |
67.60% |
59.90% |
63.10% |
66.00% |
61.20% |
61.60% |
60.60% |
|
|
Spinning |
Electrical |
59 |
89 |
82 |
64 |
80 |
59 |
72 |
|
Mechanical |
387 |
390 |
396 |
395 |
388 |
383 |
423 |
|
|
Others |
102 |
164 |
132 |
76 |
95 |
104 |
89 |
|
|
Efficiency |
61.90% |
55.30% |
57.60% |
62.80% |
60.90% |
62.10% |
59.40% |
|
|
Winding |
Electrical |
98 |
87 |
63 |
87 |
83 |
68 |
87 |
|
Mechanical |
412 |
365 |
384 |
390 |
387 |
427 |
384 |
|
|
Others |
173 |
99 |
90 |
124 |
93 |
95 |
76 |
|
|
Efficiency |
52.60% |
61.70% |
62.70% |
58.30% |
60.90% |
59.00% |
62.00% |
|
|
Precision Roll Winding |
Electrical |
45 |
65 |
88 |
54 |
59 |
78 |
90 |
|
Mechanical |
369 |
362 |
502 |
365 |
409 |
476 |
484 |
|
|
Others |
93 |
78 |
92 |
70 |
154 |
98 |
111 |
|
|
Efficiency |
64.80% |
64.90% |
52.60% |
66.00% |
56.80% |
54.70% |
52.40% |
|
|
Packaging and Inventory |
Transportation and Others |
189 |
201 |
198 |
212 |
189 |
167 |
189 |
|
Efficiency |
86.90% |
86.00% |
86.30% |
85.30% |
86.90% |
88.40% |
86.90% |
|
|
Day wise Efficiency (Before) |
66.90% |
64.39% |
65.19% |
65.78% |
63.65% |
65.70% |
63.82% |
|
As it is seen from table 2, the average efficiency level is 65.1 %. The efficiency level is low because of unorganized, uncleaned and unscheduled maintenance in the workplace. Efficiency is highly affected by the nonproductive time of mechanical issues in every section.
The nonproductive times of Batching, Carding, Drawing, Spinning, Winding, Precision and Roll winding, Packaging and inventory are taken by time study after the 6S implementation also.
Table 3: Section wise nonproductive time and overall efficiency per day after 6S implementation
|
Section |
Issue |
Non-Productive Time Throughout 24 Hours (Minutes) |
||||||
|
Day 1 |
Day 2 |
Day 3 |
Day 4 |
Day 5 |
Day 6 |
Day 7 |
||
|
Batching |
Electrical |
25 |
36 |
29 |
54 |
76 |
65 |
65 |
|
Mechanical |
333 |
353 |
345 |
334 |
354 |
343 |
345 |
|
|
Others |
49 |
78 |
53 |
43 |
32 |
76 |
69 |
|
|
Efficiency |
71.70% |
67.60% |
70.30% |
70.10% |
67.90% |
66.40% |
66.70% |
|
|
Carding |
Electrical |
15 |
39 |
50 |
47 |
40 |
45 |
62 |
|
Mechanical |
329 |
365 |
354 |
383 |
365 |
373 |
343 |
|
|
Others |
32 |
63 |
68 |
34 |
42 |
56 |
29 |
|
|
Efficiency |
73.90% |
67.60% |
67.20% |
67.80% |
69.00% |
67.10% |
69.90% |
|
|
Drawing |
Electrical |
35 |
47 |
33 |
54 |
60 |
34 |
65 |
|
Mechanical |
357 |
365 |
348 |
376 |
362 |
373 |
334 |
|
|
Others |
84 |
55 |
83 |
29 |
46 |
46 |
23 |
|
|
Efficiency |
66.90% |
67.60% |
67.80% |
68.10% |
67.50% |
68.50% |
70.70% |
|
|
Spinning |
Electrical |
32 |
50 |
44 |
58 |
51 |
47 |
65 |
|
Mechanical |
356 |
349 |
358 |
391 |
374 |
399 |
387 |
|
|
Others |
72 |
93 |
78 |
47 |
38 |
43 |
32 |
|
|
Efficiency |
68.10% |
65.80% |
66.70% |
65.60% |
67.80% |
66.00% |
66.40% |
|
|
Winding |
Electrical |
65 |
74 |
77 |
56 |
47 |
45 |
34 |
|
Mechanical |
358 |
343 |
368 |
370 |
352 |
359 |
328 |
|
|
Others |
98 |
32 |
87 |
48 |
47 |
45 |
76 |
|
|
Efficiency |
63.80% |
68.80% |
63.10% |
67.10% |
69.00% |
68.80% |
69.60% |
|
|
Precision Roll Winding |
Electrical |
27 |
36 |
69 |
49 |
30 |
56 |
65 |
|
Mechanical |
390 |
345 |
343 |
351 |
372 |
398 |
340 |
|
|
Others |
65 |
55 |
57 |
60 |
34 |
67 |
84 |
|
|
Efficiency |
66.50% |
69.70% |
67.40% |
68.10% |
69.70% |
63.80% |
66.00% |
|
|
Packaging and Inventory |
Transportation and Others |
74 |
82 |
78 |
71 |
76 |
80 |
70 |
|
Efficiency |
94.90% |
94.30% |
94.60% |
95.10% |
94.70% |
94.40% |
95.10% |
|
|
Day wise Efficiency (After) |
72.30% |
71.63% |
71.01% |
71.68% |
72.24% |
70.73% |
72.06% |
|
As it is seen from table 3, the average efficiency level is now 71.7 % which increased on average 6.6%. The efficiency level increased because of organized, cleaned and scheduled maintenance in the workplace. The nonproductive time in every section reduced at an excellent rate.
Table 4: Summary of section wise nonproductive time and overall efficiency per day before and after 6S implementation
|
Day wise Efficiency |
Day 1 |
Day 2 |
Day 3 |
Day 4 |
Day 5 |
Day 6 |
Day 7 |
Average |
|
Before |
66.90% |
64.39% |
65.19% |
65.78% |
63.65% |
65.70% |
63.82% |
65.10% |
|
After |
72.30% |
71.63% |
71.01% |
71.68% |
72.24% |
70.73% |
72.06% |
71.70% |

Fig. 13: Day wise efficiency chart before and after
There is a huge change of 6.6% in the efficiency level of whole production process. The key factor in this change is the implementation of 6S in a well-planned and sustainable way. As per figure 13, the efficiency level is at a constant level of around 71% which is also an important outcome. And this consistent efficiency level is especially important for a manufacturing-based company.
The implementation of the 6S methodology has significantly enhanced the efficiency of the whole production process. By systematically organizing, sorting, and shining workspaces, elimination of unnecessary clutter is done and optimized the layout for streamlined operations. Standardizing procedures and establishing clear guidelines has not only reduced errors but also improved overall consistency in our output. The systematic approach of 6S, which includes sustaining and ensuring ongoing improvements, has fostered a culture of continuous enhancement, leading to increased productivity and a more efficient production workflow.
The following table 5 and table 6 show the overall wastage per day before and after implementing 6S. Table 7 summarizes the day wise wastage along with their average regarding before and after implementation of 6S which is represented in a line chart as shown in figure 13.
The amount of wastage of Batching, Carding, Drawing, Spinning, Winding, Precision and Roll winding are taken by taking their weight at the end of each day before the 6S implementation.
Table 5: Section wise amount of wastage before 6S implementation
|
Section |
Wastage Type |
Wastage (Kg) |
||||||
|
Day 1 |
Day 2 |
Day 3 |
Day 4 |
Day 5 |
Day 6 |
Day 7 |
||
|
Batching |
Sliver |
130.5 |
129 |
135 |
130 |
132 |
131 |
135 |
|
Caddis |
21 |
20.5 |
23 |
20 |
20.5 |
20 |
22 |
|
|
Carding |
Sliver |
189 |
187 |
193 |
191 |
190 |
189 |
188 |
|
Caddis |
22 |
21.5 |
23 |
22 |
21.5 |
21 |
20.5 |
|
|
Drawing |
Sliver |
119 |
120 |
123 |
120 |
125 |
122 |
121 |
|
Caddis |
13 |
13.5 |
15 |
13 |
14 |
13.5 |
13 |
|
|
Spinning |
Sliver |
27 |
29 |
30 |
31 |
29 |
28 |
31 |
|
Caddis |
23 |
22 |
24 |
27 |
26 |
24 |
26 |
|
|
Thread |
2 |
2.5 |
3 |
3 |
2.75 |
2.5 |
3.5 |
|
|
Winding |
Thread |
95 |
99 |
98 |
101 |
97 |
102 |
104.5 |
|
Caddis |
13 |
14 |
17 |
18.5 |
15 |
17 |
19 |
|
|
Precision Roll Winding |
Thread |
59 |
58 |
61 |
63 |
67 |
60 |
59 |
|
Caddis |
19 |
22 |
23 |
25 |
19 |
21 |
22 |
|
|
Total Wastage (Before) |
733 |
738 |
768 |
764.5 |
758.8 |
751 |
764.5 |
|
As it is seen from table 5, the average amount of wastage per day is 754 kg. The amount of wastage is high because of jam in machines, imbalanced order, quality mixing, unorganized, uncleaned and unscheduled maintenance in the workplace. The efficiency is highly affected by the nonproductive time of mechanical issues in every section.
The amount of wastage of Batching, Carding, Drawing, Spinning, Winding, Precision and Roll winding are taken by taking their weight at the end of each day after the 6S implementation.
Table 6: Section wise amount of wastage after 6S implementation
|
Section |
Wastage Type |
Wastage (Kg) |
||||||
|
Day 1 |
Day 2 |
Day 3 |
Day 4 |
Day 5 |
Day 6 |
Day 7 |
||
|
Batching |
Sliver |
126 |
125.5 |
130 |
124 |
123 |
128 |
127 |
|
Caddis |
18 |
20 |
20.5 |
18 |
17 |
19 |
20 |
|
|
Carding |
Sliver |
178 |
181 |
186 |
179 |
180 |
187 |
181 |
|
Caddis |
19.5 |
20 |
21 |
19 |
19.5 |
20 |
20 |
|
|
Drawing |
Sliver |
103 |
109 |
111 |
105 |
105 |
106 |
109 |
|
Caddis |
10.5 |
11 |
12 |
10.5 |
10.5 |
11.5 |
11 |
|
|
Spinning |
Sliver |
23 |
24.5 |
25 |
24 |
24 |
25 |
24 |
|
Caddis |
17 |
19 |
21 |
20 |
19 |
20 |
21 |
|
|
Thread |
0.5 |
0.75 |
1 |
1 |
0.75 |
1 |
0.75 |
|
|
Winding |
Thread |
85 |
90 |
91 |
87 |
87 |
90 |
91 |
|
Caddis |
9 |
9.5 |
9 |
8.75 |
9 |
9.5 |
10 |
|
|
Precision Roll Winding |
Thread |
44 |
51 |
45 |
44 |
45 |
48 |
47 |
|
Caddis |
11 |
10 |
12 |
11.5 |
11.5 |
11 |
10.5 |
|
|
Total Wastage (After) |
645 |
671.3 |
684.5 |
651.8 |
651.3 |
676 |
672.3 |
|
As it is seen from table 6, the average amount of wastage per day is 665 kg. The amount of wastage is reduced to around 100 kg’s because of less jam I machine, balanced order, no quality mixing, organized, cleaned and scheduled maintenance in the workplace.
Table 7: Summary of section wise amount of wastage per day before and after 6S implementation
|
Total Wastage (Kg) |
Day 1 |
Day 2 |
Day 3 |
Day 4 |
Day 5 |
Day 6 |
Day 7 |
Average |
|
Before |
732.5 |
738 |
768 |
764.5 |
758.75 |
751 |
764.5 |
754 |
|
After |
644.5 |
671.25 |
684.5 |
651.75 |
651.25 |
676 |
672.25 |
665 |
The average wastage after 6S implementation is 665 kg compared to 754 kg of wastage that was produced before 6S implementation (Fig. 7). The integration of the 6S methodology has yielded notable improvements in minimizing wastage throughout our company's production process. Through the sequential steps of Sort, Set in order, Shine, Standardize, Sustain, and Safety successfully restructured the workflow. This methodical approach has not only led to a reduction in waste but has also instilled a sense of organization and efficiency. The systematic elimination of unnecessary elements and the establishment of standardized procedures have collectively contributed to a leaner, more resource-conscious production system. As a result, the company is experiencing enhanced operational effectiveness and a more sustainable approach to manufacturing.
Table 8: Performance parameters before and after results of implementation of 6S
|
Parameters |
Before |
After |
|
|
Wastage (Kg) |
754 Kg |
665 Kg |
|
|
Average Efficiency (%) |
65.10% |
71.70% |
|
|
Working Environment |
Not Good |
Better |
|
|
Safety |
Not Safe |
Standard |
|
|
|
|
||
|
|
|
||

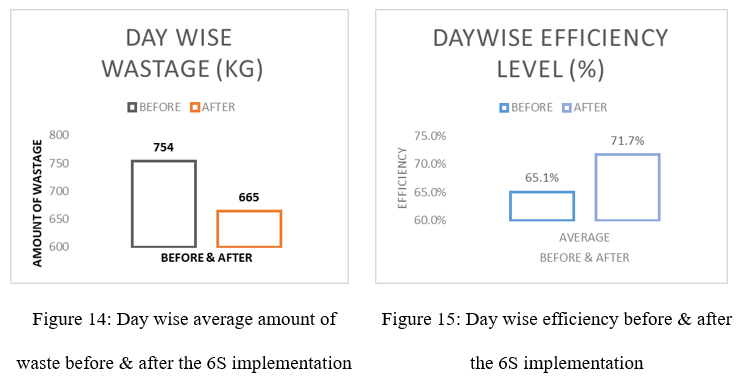
Table 8 summarizes the performance parameters before and after the implementation of 6S. As per figure 14, the average amount of wastage of each day was average of 754 kg before implementation of the 6S method and the average amount of wastage is 665 kg after implementation of the 6S method. As seen from figure 15, the average efficiency rose to 71.7% from 65.1% after implementing 6S method, indicating the improvement of wastage reduction target per day and reduces the unnecessary usages of properties resulting in improvement in productivity, efficiency and a smaller number of nonproductive hours.
To examine the statistical significance of performance improvement after the implementation of 6S, a paired sample t-test was conducted using day-wise data collected before and after the intervention. Since the same production system was evaluated under identical operating conditions, the paired t-test was considered appropriate.
Table 9: statistical t-test analysis results before & after implementation of 6S
|
Parameter |
Mean (Before) |
Mean (After) |
Result |
|
Efficiency (%) |
65.1 |
71.7 |
Significant (p < 0.05) |
|
Wastage (kg/day) |
754 |
665 |
Significant (p < 0.05) |
From table 9, the statistical analysis confirms that the improvements in both efficiency and wastage reduction after the implementation of 6S are significant at the 95% confidence level. The results indicate that the mean production efficiency increased from 65.1% before implementation to 71.7% after implementation, and this improvement was found to be statistically significant at the 95% confidence level (p < 0.05). In addition, the average daily wastage decreased from 754 kg to 665 kg after 6S implementation. The reduction in wastage was also statistically significant (p < 0.05). These findings confirm that the improvements observed after the implementation of 6S are not due to random variation but are directly associated with the systematic application of 6S practices in the jute spinning facility.
Key performance indicators such as increased productivity, reduced waste, and improved safety records serve as tangible evidence of the sustained success of 6S implementation. These metrics demonstrate our ongoing commitment to excellence and efficiency.
This jute mill's adoption of the 6S system has shown to be a revolutionary endeavor with numerous beneficial outcomes. The impact is multifaceted, ranging from financial benefits and the development of a pleasant workplace culture to operational efficiency and quality enhancement.
5. Conclusion
Jute industry is historically and culturally important for Bangladesh [18]. Jute plays an important role as one of its cash crops, contributing to Bangladesh’s economy [19]. Thus productivity, efficiency and also safety are paramount in jute industry. Hence the implementation of 6S can be crucial. So, the 6S implementation is done in “Janata Jute Mills, Faridpur” which is one of the biggest spinning industries of Bangladesh. The implementation results from figure 14 and 15 show that day wise wastage reduced by around 89 kg from 754 kg to 665 kg while day wise efficiency increased by around 6.6% from 65.1% to 71.7%. The overall workplace is organized and tidied up which improved productivity, employee satisfaction and decreased the risk of accidents. Both qualitative and quantitative study provides a comprehensive understanding by providing detailed insights of the 6S implementation. This application shows how important it is for the jute industry to implement 6S to identify and exclude the nonproductive times along with reduce wastage. According to [20], the 6S management effectively increased the quality of nursing management, improved rescue operations efficiency and increased nurses’ satisfaction. Similarly, improvement in the level of efficiency, neat and clean, safe work environment with process improvement is the ultimate result of implementation of 6S in the Jute industry.
Finally, the successful integration of 6S with traditional jute processing practices is a pivotal achievement. The ability to harmonize modern methodologies with industry traditions positions companies as a forward-thinking entity. In near future, this Jute spinning facility will emerge as a globally competitive player, balancing tradition with innovation. The present study has certain limitations such as the data is limited to only seven days. High volume of data can produce more accurate results. Further improvement in this study can be to integrate machine learning models to reduce sorting errors and use AI driven process automation to ensure workplace safety.
Acknowledgments
The assistance and encouragement provided for our initiative by the authority of Janata Jute Mills Limited, Faridpur is really appreciated.
Declaration of interest
The authors declare that they have no known competing financial interests or personal relationships that could have appeared to influence the work reported in this paper.
Funding
This research did not receive any specific grant from funding agencies in the public, commercial, or not-for-profit sectors.
Data availability statement
The authors confirm that the data supporting the findings of this study are available within the article.
References
[1] Shahinur S, Alamgir Sayeed MM, Hasan M, et al. Current Development and Future Perspective on Natural Jute Fibers and Their Biocomposites. Polymers 2022, Vol 14, Page 1445. 2022;14(7):1445.
[2] Sharif Ullah AMM, Shahinur S, Haniu H. On the Mechanical Properties and Uncertainties of Jute Yarns. Materials 2017, Vol 10, Page 45. 2017;10(5):450.
[3] Toky MDSR, Tuly SA, Chendrima M, et al. JUTE INDUSTRY OF BANGLADESH: CURRENT STATE & GLOBAL DEMAND. Supply Chain Insider | ISSN: 2617-7420 (Print), 2617-7420 (Online). 2022;7(1):2617–7420.
[4] Islam MM. Advanced Production Technology and Processing of Jute. Agronomic Crops. Singapore: Springer Singapore; 2019. p. 387–440.
[5] Satria MA, Ernawati M, Wicaksono B, et al. Observation of Sort, Set, Shine, Standardize, and Sustain in a Manufacturing Company Surabaya. The Indonesian Journal of Occupational Safety and Health. 2022;11(2):195–203.
[6] Randhawa JS, Ahuja IS. 5S implementation methodologies: literature review and directions. International Journal of Productivity and Quality Management. 2017;20(1):48.
[7] Kanamori S, Sow S, Castro MC, et al. Implementation of 5S management method for lean healthcare at a health center in Senegal: a qualitative study of staff perception. Glob Health Action. 2015;8(1).
[8] Sukdeo N. The application of 6S methodology as a lean improvement tool in an ink manufacturing company. 2017 IEEE International Conference on Industrial Engineering and Engineering Management (IEEM). IEEE; 2017. p. 1666–1671.
[9] Talapatra S, Gaine A. Putting Green Lean Six Sigma Framework into Practice in a Jute Industry of Bangladesh: A Case Study. American Journal of Industrial and Business Management. 2019;09(12):2168–2189.
[10] Nazarali S, Rayat J, Salmonson H, et al. The application of a “6S Lean” initiative to improve workflow for emergency eye examination rooms. Canadian Journal of Ophthalmology. 2017;52(5):435–440.
[11] Shahin M, Chen FF, Hosseinzadeh A, et al. Enhanced safety implementation in 5S + 1 via object detection algorithms. The International Journal of Advanced Manufacturing Technology. 2023;125(7–8):3701–3721.
[12] Jiménez M, Romero L, Fernández J, et al. Extension of the Lean 5S Methodology to 6S with An Additional Layer to Ensure Occupational Safety and Health Levels. Sustainability. 2019;11(14):3827.
[13] Al-Arnous AB, Abdelwahed NAA. The Impact of the Implementation of Safety Measures on Frontline Workers’ Safety Accountability: A Saudi Arabian Case Study of a Well Intervention Business Model. Safety 2022, Vol 8, Page 82. 2022;8(4):82.
[14] Sader S, Husti I, Daróczi M. Industry 4.0 as a Key Enabler toward Successful Implementation of Total Quality Management Practices. Periodica Polytechnica Social and Management Sciences. 2019;27(2):131–140.
[15] Domínguez RA, Espinosa M del M, Domínguez M, et al. Lean 6S in Food Production: HACCP as a Benchmark for the Sixth S “Safety.” Sustainability. 2021;13(22):12577.
[16] Manzanares-Cañizares C, Sánchez-Lite A, Rosales-Prieto VF, et al. A 5S Lean Strategy for a Sustainable Welding Process. Sustainability. 2022;14(11):6499.
[17] Soltaninejad M, Fardhosseini MS, Kim YW. Safety climate and productivity improvement of construction workplaces through the 6S system: mixed-method analysis of 5S and safety integration. International Journal of Occupational Safety and Ergonomics. 2022;28(3):1811–1821.
[18] Rahman S, Kazal M, Begum I, et al. Exploring the Future Potential of Jute in Bangladesh. Agriculture. 2017;7(12):96.
[19] Akter S, Sadekin MN, Islam N. Jute and Jute Products of Bangladesh: Contributions and Challenges. Asian Business Review. 2020;10(3):143–xxx.
[20] Wang X, Liu Y. Application of Lean Visual and “6S” Management Concept in Clinical Nursing. J Multidiscip Healthc. 2023;Volume 16:3923–3931.


Georgia Reader Reply
Et rerum totam nisi. Molestiae vel quam dolorum vel voluptatem et et. Est ad aut sapiente quis molestiae est qui cum soluta. Vero aut rerum vel. Rerum quos laboriosam placeat ex qui. Sint qui facilis et.