The Influence of Humidity Control on Jute Yarn Quality: A Path Toward Sustainability
Abstract
Md Mehedi Hasan Niloya*, Shoaib Islam Zicob, Rafid Ahmed Chowdhurya, Mahmudul Hasan Pervesc, Elias Khalild
aDepartment of Industrial and Production Engineering, Shahjalal University of Science and Technology, Sylhet-3114, Bangladesh
bDepartment of Jute and Fibre Technology, University of Calcutta, Kolkata, West Bengal 700073, India
cDepartment of Industrial and Production Engineering, Shahjalal University of Science and Technology, Sylhet-3114, Bangladesh
dTangail Textile Engineering College, Tangail, Bangladesh.
Corresponding Author: mehediniloy334010@gmail.com
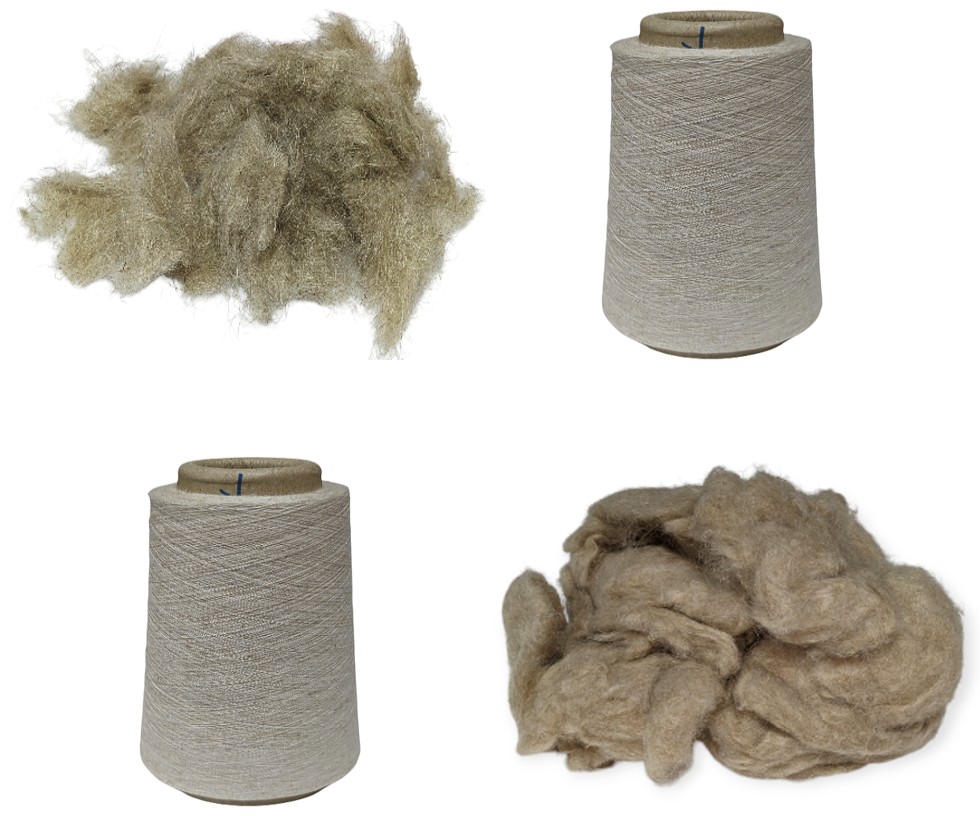
Jute, a natural hygroscopic fiber, is highly sensitive to environmental humidity, which significantly affects its physical properties. This study examines the impact of a humidity control system on jute yarn quality during spinning, focusing on yarn count, breaking strength, moisture content, quality ratio and twists per inch (TPI). Experiments were conducted under two humidity conditions: 67% relative humidity (RH) (system active) and 52% RH (system inactive). Results indicate that maintaining optimal humidity (67% RH) enhances yarn quality by improving tensile strength (+9.7%), reducing end breakages (-78.6%), and ensuring consistent yarn count and TPI. Higher humidity reduces fiber brittleness, leading to better fiber integrity and reduced production inefficiencies. In contrast, lower humidity resulted in inconsistent yarn properties and increased breakages. These findings emphasize the importance of humidity control systems in enhancing jute yarn quality, reducing waste, and improving efficiency in textile manufacturing.
Full Text
1.
Introduction In
the highly technical domain of textile manufacturing, the pursuit of excellence
in yarn production is a continuous endeavor. Within this context, environmental
conditions, particularly humidity, have emerged as critical determinants of
yarn quality (Cottrell et al., 2023). This study
investigates the significant impact of humidity management systems on the
quality of jute yarn during the spinning process. Jute, a highly absorbent and
sustainable natural fiber, remains central to this inquiry due to its distinct
characteristics, which necessitate precise environmental control (Cole, 2024). The moisture content in fibers like jute significantly impacts
their essential physical properties (Singh et al., 2018). The amount of water absorbed
influences many of a fiber's physical properties, including tensile strength
and breakage (Aranha et al., 2024). So,
variations in the relative humidity of the surrounding environment during yarn
production are expected to alter yarn breakage rates and overall product
quality (Cottrell et al., 2023; Yu et al., 2016). In
examining the relationship between humidity and the quality of jute yarn,
various crucial parameters come under scrutiny. Yarn strength changes with the
level of relative humidity (Smail et al., 2021). Key quality metrics
include yarn count, which defines the fineness or thickness of the yarn and
plays a crucial role in determining its application and performance
characteristics. Yarn strength, a fundamental parameter, is analyzed to assess
the tensile capacity and durability of jute yarn under different humidity
conditions (Shi et al., 2022). The coefficient of variation
(CV), a statistical measure, provides insights into yarn consistency and
uniformity, essential for producing reliable and standardized products (Dai et al., 2023). Additionally, moisture
content is significant, as it directly influences the hygroscopic nature of
jute fibers, affecting their pliability and handling during the spinning
process (Shahinur et al., 2022). Twist per inch (TPI)
is another crucial factor, impacting the yarn's structure, strength, and
overall performance (Singh et al., 2018). Through precise
measurement and analysis of these quality parameters, this study enhances the
understanding of the intricate interplay between humidity and jute yarn
quality, paving the way for optimized production processes and improved product
excellence in the jute industry. At the core of this investigation is the recognition
that raw jute fibers are highly sensitive to humidity fluctuations (Samir et al., 2022). Breaking strength is measured using a yarn lea
strength tester, a specialized machine that assesses the tensile properties of
yarn. The testing process involves securing the yarn sample between two jaws
and subjecting it to a controlled extension rate until failure occurs. The
recorded breaking strength provides a quantitative measure of the yarn’s
durability and performance under stress.
2.4 Moisture content (%)
The moisture content (MC%) of jute yarn is directly influenced by surrounding humidity levels, which impact critical quality parameters such as tensile strength and quality ratio. Maintaining an optimal moisture level is essential for ensuring yarn durability and consistency. A moisture meter is used to measure the moisture ratio in jute yarn. The obtained moisture ratio is then converted into moisture content (%) using the Equation (2):

2.5 Quality ratio (%)
The quality ratio is one of the properties of jute yarn that indicates the breaking load (Islam et al., 2024). It is calculated as the percentage ratio of single yarn strength (in pounds) to yarn count (in lbs/spyndle), where 1 spyndle = 14,400 yards. The quality ratio is determined using the Equation (3).

2.6 Twists in per inch (TPI)
Twists per inch (TPI) refers to the number of twists or turns in one inch of yarn. This parameter plays a crucial role in defining yarn strength, structure, and flexibility. TPI is measured using a specialized testing machine, which displays the twist level for quality control and process optimization.
2.7 Ends down
Ends down refers to the number of yarn breakages before being twisted onto a bobbin. Frequent end breakages can negatively impact spindle speed, reduce yarn quality, and affect the mechanical condition of spinning machines. Proper humidity control and optimized spinning conditions help minimize ends down, improving production efficiency and yarn durability.
2.8 Measuring RH
Relative humidity (RH) in the production area was measured using a calibrated digital thermo-hygrometer installed at the spinning zone near the jute yarn processing machines. The instrument continuously monitored RH and temperature in real time to ensure accurate environmental control.
3. Experimental analysis
Yarn samples were collected daily under both system-on and system-off conditions to measure key quality parameters, including yarn count, breaking strength, moisture ratio, quality ratio, twists per inch (TPI), and number of ends down.
3.1 Samples specification
Table 1: Samples Specifications
|
Sample |
Sample Description |
Type of Test |
|
Jute Yarn |
25 Yards |
Average Count Measurement |
|
Jute Yarn |
22-inch Length |
Breaking Strength Measurement |
|
Jute Yarn |
Yarn with Bobbin |
Moisture Content measurement |
|
Jute Yarn |
Yarn with Bobbin |
Quality Ratio measurement |
|
Jute Yarn |
15-inch Length |
TPI Measurement |
In the experimental setup, the humidity control system was programmed to maintain two specific humidity levels: 67% RH as the "on" state and 52% RH as the "off" state. These levels were selected based on preliminary investigations and industry standards, representing typical environmental conditions in jute yarn manufacturing.
RH readings were recorded at regular intervals during the experimental period, and calibration of the measuring device was verified prior to data collection to ensure measurement accuracy and reliability.
During the experimental trials, jute yarn samples were subjected to these controlled humidity conditions for a predetermined duration. The breaking strength, average count, quality ratio and TPI of the jute yarn were measured under each condition.
Breaking strength was assessed using a universal testing machine, which applied controlled tension to the yarn until failure, providing an accurate measure of its tensile properties. The average count, representing yarn fineness, was measured in terms of the number of hanks per unit weight. The quality ratio, a composite measure of multiple yarn properties, was determined using standardized assessment criteria (Alias et al., 2018).
3.2 System on
While the humidity control system was active, a total of fifteen samples of 10/1 count yarn were collected to measure yarn weight. The key parameters measured included yarn count, breaking strength, moisture ratio, quality ratio, and TPI. Additionally, the number of ends down was recorded over an 8-hour shift.
The relative humidity (RH) level was maintained at 67.4% on Day 1, 67.3% on Day 2, and remained at 67.3% on Day 3. The quality parameters measured under these conditions are presented in Tables 2, 3, and 4, respectively. Table 5 provides a summary of the analyzed quality parameters across all three days under controlled humidity conditions.
Table 2: Quality parameters on Day 1 while system on
|
Yarn Weight (25 Yards) |
Count |
Breaking Strength (Kgs) |
Moisture Ratio (%) |
Cyc QR (%) |
TPI |
Number of ends down (8 hours) |
|
|
8.95 |
11.37 |
4.4 |
15.6 |
|
4.3 |
|
|
|
8.8 |
11.17 |
3.8 |
16.7 |
|
4.1 |
|
|
|
8.32 |
10.57 |
4.2 |
14.6 |
|
3.9 |
|
|
|
8.51 |
10.81 |
4.8 |
16.3 |
|
4.5 |
|
|
|
8.91 |
11.31 |
4.2 |
14.4 |
|
3.8 |
|
|
|
8.38 |
10.64 |
4 |
16 |
|
4.3 |
|
|
|
8.42 |
10.69 |
5.6 |
15.8 |
91.65 |
4.5 |
51 |
|
|
8.79 |
11.16 |
3.6 |
15.8 |
|
4.4 |
|
|
|
8.35 |
10.6 |
3.8 |
16.6 |
|
4.6 |
|
|
|
8.46 |
10.74 |
4.8 |
16.7 |
|
4.2 |
|
|
|
8.85 |
11.24 |
3.8 |
15.1 |
|
4.3 |
|
|
|
8.22 |
10.44 |
4 |
16.7 |
|
4.2 |
|
|
|
8.6 |
10.92 |
5 |
16.3 |
|
4.6 |
|
|
|
8.57 |
10.88 |
5.6 |
16.1 |
|
4.4 |
|
|
|
8.36 |
10.62 |
5 |
15 |
|
4.1 |
|
|
|
Average |
10.88 |
4.44 |
15.85 |
91.65 |
4.28 |
51 |
|
|
SD* |
0.3 |
0.66 |
0.77 |
|
0.2 |
|
|
|
CV** (%) |
2.80% |
14.80% |
4.80% |
|
5.50% |
|
|
Table 3: Quality parameters on Day 2 while system on
|
Count |
Breaking Strength (Kgs) |
Moisture Ratio (%) |
Cyc QR (%) |
TPI |
Number of ends down (8 hours) |
|
|
8.78 |
11.15 |
3.4 |
15.7 |
|
4.3 |
|
|
8.24 |
10.46 |
4.8 |
16 |
|
4.6 |
|
|
8.38 |
10.64 |
3.2 |
15.4 |
|
4.3 |
|
|
7.51 |
9.54 |
4 |
15.2 |
|
3.9 |
|
|
8.35 |
10.6 |
3.6 |
13.4 |
|
4.5 |
|
|
8.56 |
10.87 |
5.4 |
15.4 |
|
4.5 |
|
|
8.64 |
10.97 |
4.2 |
16.5 |
|
4.3 |
|
|
7.3 |
9.27 |
3.6 |
16.4 |
90.67 |
4.3 |
42 |
|
8.55 |
10.86 |
4.4 |
16.4 |
|
4.5 |
|
|
8.39 |
10.65 |
4.4 |
15.8 |
|
4.4 |
|
|
8.39 |
10.65 |
4.4 |
15.9 |
|
4.2 |
|
|
8.48 |
10.77 |
4.4 |
15.8 |
|
4.4 |
|
|
7.65 |
9.71 |
3.4 |
15.7 |
|
4 |
|
|
7.97 |
10.12 |
4.4 |
15.3 |
|
4.3 |
|
|
8.28 |
10.51 |
5.8 |
16.5 |
|
4 |
|
|
Average |
10.45 |
4.23 |
15.69 |
90.67 |
4.3 |
42 |
|
SD |
0.55 |
0.74 |
0.77 |
|
0.2 |
|
|
CV (%) |
5.30% |
17.40% |
4.90% |
|
4.70% |
|
Table 4: Quality parameters on Day 3 while system on
|
Yarn Weight (25 Yards) |
Count |
Breaking Strength (Kgs) |
Moisture Ratio (%) |
Cyc QR (%) |
TPI |
Number of ends down (8 hours) |
|
8.14 |
10.34 |
4.8 |
15.5 |
|
4.5 |
|
|
8.27 |
10.5 |
4.8 |
15.2 |
|
4.1 |
|
|
8.14 |
10.34 |
4 |
15.1 |
|
4.9 |
|
|
7.49 |
9.51 |
4 |
15.5 |
|
4.2 |
|
|
8.46 |
10.74 |
3.6 |
15.7 |
|
3.7 |
|
|
7.9 |
10.03 |
4.6 |
16.2 |
|
4.6 |
|
|
8.53 |
10.83 |
3.8 |
15.7 |
|
4.1 |
|
|
8.54 |
10.84 |
4.2 |
16.2 |
89.86 |
4.4 |
67 |
|
7.97 |
10.12 |
3.8 |
15 |
|
3.9 |
|
|
7.61 |
9.66 |
4.4 |
15.3 |
|
4.1 |
|
|
8.68 |
11.02 |
4.8 |
16 |
|
4.3 |
|
|
8.44 |
10.72 |
3.6 |
15.8 |
|
4.5 |
|
|
7.32 |
9.3 |
4.1 |
15.9 |
|
3.9 |
|
|
8.83 |
11.21 |
4.4 |
15.63 |
|
4.1 |
|
|
8.52 |
10.82 |
3.65 |
15.7 |
|
4.3 |
|
|
Average |
10.4 |
4.17 |
15.63 |
89.86 |
4.24 |
67 |
|
SD |
0.57 |
0.44 |
0.37 |
|
0.3 |
|
|
CV (%) |
5.50% |
10.60% |
2.40% |
|
7.30% |
|
Table 5: Summary of Quality parameters while system on
|
Average count |
CV (%) of average count |
Breaking strength (kgs) |
Moisture ratio (%) |
Cyc QR (%) |
TPI |
Number of ends down (8 hours) |
|
|
Day 1 |
10.88 |
2.80% |
4.44 |
15.85 |
91.65 |
4.3 |
51 |
|
Day 2 |
10.45 |
5.30% |
4.23 |
15.69 |
90.67 |
4.3 |
42 |
|
Day 3 |
10.4 |
5.50% |
4.17 |
15.63 |
89.86 |
4.2 |
67 |
|
Average |
10.58 |
4.50% |
4.28 |
15.72 |
90.73 |
4.27 |
53 |
3.3 System off
With the humidity control system off, fifteen samples of 10/1 count yarn were collected to measure yarn weight. The count, breaking strength, moisture ratio, quality ratio, and TPI were recorded, along with the number of ends down over an 8-hour shift.
The relative humidity (RH) levels were 52.3% on Day 1, 51.8% on Day 2, and 52.5% on Day 3. The measured quality parameters for each day are presented in Tables 6, 7, and 8, respectively. Table 9 provides a summary of the analyzed quality parameters across all three days under system-off conditions.
Table 6: Quality parameters on Day 1 while system off
|
Yarn weight (25 Yards) |
Count |
Breaking Strength (Kgs) |
Moisture Ratio (%) |
Cyc QR (%) |
TPI |
Number of ends down (8 hours) |
|
7.95 |
10.1 |
4.4 |
13.8 |
|
4 |
|
|
8.17 |
10.37 |
3.8 |
12.9 |
|
4.1 |
|
|
8.05 |
10.22 |
3.6 |
13.2 |
|
3.7 |
|
|
7.67 |
9.74 |
4.4 |
15.2 |
|
4 |
|
|
7.64 |
9.7 |
3.4 |
14.2 |
|
4.5 |
|
|
7.71 |
9.79 |
4 |
13.4 |
|
4.5 |
|
|
7.61 |
9.66 |
3.8 |
14.4 |
|
4.4 |
|
|
7.97 |
10.12 |
3.4 |
14.1 |
86.44 |
4.3 |
236 |
|
7.81 |
9.92 |
4 |
12.3 |
|
4.5 |
|
|
8.14 |
10.34 |
3.6 |
13.3 |
|
4.4 |
|
|
6.73 |
8.55 |
3.6 |
12.5 |
|
4.2 |
|
|
8.35 |
10.6 |
3.8 |
13.3 |
|
4.4 |
|
|
7.81 |
9.92 |
3.6 |
13 |
|
4.4 |
|
|
7.51 |
9.54 |
3.8 |
12.3 |
|
4.3 |
|
|
7.86 |
9.98 |
5.2 |
13.7 |
|
4 |
|
|
Average |
9.9 |
3.89 |
13.44 |
86.44 |
4.25 |
236 |
|
SD |
0.48 |
0.47 |
0.81 |
|
0.2 |
|
|
CV (%) |
4.80% |
12.10% |
6.10% |
|
5.60% |
|
Table 7: Quality parameters on Day 2 while system off
|
Count |
Breaking Strength (Kgs) |
Moisture Ratio (%) |
Cyc QR (%) |
TPI |
Number of ends down (8 hours) |
|
|
8.14 |
10.34 |
3.63 |
13.17 |
|
4.2 |
|
|
7.57 |
9.61 |
4.22 |
13.01 |
|
4.1 |
|
|
8.04 |
10.21 |
3.88 |
13.1 |
|
4.2 |
|
|
7.83 |
9.94 |
3.37 |
13.07 |
|
4.22 |
|
|
6.97 |
8.85 |
3.52 |
13.04 |
|
4.61 |
|
|
8.02 |
10.18 |
4.3 |
13.42 |
|
3.98 |
|
|
7.82 |
9.93 |
4.15 |
13.31 |
|
4.42 |
|
|
7.05 |
8.95 |
3.36 |
13.87 |
|
3.95 |
|
|
7.31 |
9.29 |
4.06 |
13.26 |
86.89 |
4.28 |
262 |
|
7.56 |
9.6 |
3.71 |
13.68 |
|
4.12 |
|
|
7.5 |
9.53 |
4.07 |
13.14 |
|
4.37 |
|
|
7.73 |
9.82 |
4.01 |
13.8 |
|
4.54 |
|
|
8.1 |
10.29 |
4.22 |
13.32 |
|
4.18 |
|
|
7.35 |
9.33 |
3.86 |
13.78 |
|
4 |
|
|
7.57 |
9.62 |
3.67 |
13.44 |
|
4.13 |
|
|
Average |
9.7 |
3.87 |
13.36 |
86.89 |
4.22 |
262 |
|
SD |
0.46 |
0.31 |
0.3 |
|
0.2 |
|
|
CV (%) |
4.80% |
8.00% |
2.20% |
|
4.60% |
|
Table 8: Quality parameters on Day 3 while system off
|
Yarn weight (25 Yards) |
Count |
Breaking Strength (Kgs) |
Moisture Ratio (%) |
Cyc QR (%) |
TPI |
Number of ends down (8 hours) |
|
7.25 |
9.21 |
3.8 |
13.37 |
|
4.2 |
|
|
8.09 |
10.27 |
4.33 |
13.21 |
|
4.1 |
|
|
7.24 |
9.19 |
3.67 |
13.3 |
|
4.9 |
|
|
7.88 |
10.01 |
3.86 |
13.37 |
|
4.2 |
|
|
7.89 |
10.02 |
3.64 |
13.24 |
|
3.7 |
|
|
7.74 |
9.83 |
3.94 |
13.42 |
|
4.1 |
|
|
7.6 |
9.65 |
4 |
14.02 |
|
4.1 |
|
|
8.21 |
10.43 |
4.01 |
13.37 |
|
4.4 |
|
|
7.68 |
9.75 |
4.19 |
13.26 |
88.29 |
3.9 |
247 |
|
6.88 |
8.74 |
4.16 |
13.68 |
|
4.1 |
|
|
8.34 |
10.59 |
3.96 |
13.14 |
|
4.3 |
|
|
7.71 |
9.79 |
3.62 |
13.5 |
|
4.3 |
|
|
7.35 |
9.33 |
4.11 |
13.32 |
|
3.9 |
|
|
8.19 |
10.4 |
3.77 |
13.78 |
|
4.1 |
|
|
7.53 |
9.57 |
3.89 |
13.44 |
|
4.2 |
|
|
Average |
9.79 |
3.93 |
13.43 |
88.29 |
4.17 |
247 |
|
SD |
0.52 |
0.21 |
0.24 |
|
0.3 |
|
|
CV (%) |
5.40% |
5.40% |
1.80% |
|
6.50% |
|
Table 9: Summary of Quality parameters while system off
|
Average count |
CV (%) of average count |
Breaking strength (kgs) |
Moisture ratio (%) |
Cyc QR (%) |
TPI |
Number of ends down (8 hours) |
|
|
Day 1 |
9.79 |
4.80% |
3.93 |
13.43 |
86.44 |
4.17 |
236 |
|
Day 2 |
9.7 |
4.80% |
3.87 |
13.36 |
86.89 |
4.22 |
262 |
|
Day 3 |
9.9 |
5.40% |
3.89 |
13.44 |
88.29 |
4.25 |
247 |
|
Average |
9.8 |
4.99% |
3.9 |
13.41 |
87.21 |
4.21 |
248 |
4. Results and discussion
This section presents a comparative analysis of key quality parameters under controlled and uncontrolled humidity conditions. Table 10 provides a summary of the measured parameters, highlighting the influence of humidity control on jute yarn quality.
Table 10: Summary Table of Quality Parameters
|
Quality Parameters |
System On |
System Off |
|
Actual Count (lbs/1 Ply) |
10 |
10 |
|
Average Count (lbs/1 Ply) |
10.58 |
9.8 |
|
CV (%) Of Average Count (%) |
4.5 |
4.99 |
|
Strength (Kgs) |
4.28 |
3.9 |
|
Moisture Ratio - M/R (%) |
15.72 |
13.41 |
|
Quality Ratio - QR (%) |
90.73 |
86.44 |
|
Twist Per Inch – TPI |
4.27 |
4.21 |
|
Ends Down |
53 |
248 |
|
Work Environment |
Better |
Good |
The following subsections analyze the impact of humidity control on individual quality parameters, providing insights into how the system enhances jute yarn performance.
4.1 Average Count
The average count remained consistent with the actual count when the humidity control system was active.

As shown in Figure 2, the actual count was 10 lbs/1 ply, and the measured average count was 10.58 under controlled humidity. In contrast, when the system was off, the average count fell to 9.8, below the actual count. This reduction is attributed to moisture absorption, as jute fibers expand in a humid environment, increasing mass and diameter. The findings suggest that proper humidity regulation ensures the desired yarn count, leading to improved consistency and quality.
4.2 Breaking Strength
Humidity control had a significant impact on the breaking strength of jute yarn.

Figure 3 shows that the breaking strength was 4.28 kg under controlled humidity but dropped to 3.90 kg when the system was off. Higher humidity levels promote moisture absorption, enhancing fiber flexibility and cohesion, thereby improving the yarn's ability to withstand stress. While in low humidity, the fibers become brittle, leading to reduced tensile strength.
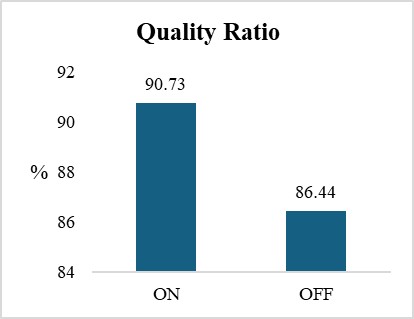
4.3 The Quality ratio (%)
The quality ratio (QR) was also higher when the humidity control system was on.

Figure 4 indicates that QR was 90.73% under controlled conditions, compared to 86.44% when the system was off. The improvement in QR can be attributed to better fiber cohesion, as moisture absorption enhances both strength and elasticity.
4.4 Twist Per Inch (TPI) level
The TPI level remained closer to the intended value under controlled humidity. A stable humidity environment helps fibers twist more uniformly, producing a tighter and more structured yarn.

Fig.5: Twist per inch (TPI)
The set TPI level was 4.25, and the observed TPI values were 4.27 with the system on and 4.21 with the system off (Figure 5). Without humidity control, the lack of sufficient moisture can lead to inconsistent twisting, affecting overall yarn quality.
4.5 Ends down
A major advantage of the humidity control system was the significant reduction in ends down (yarn breakages).

Fig.6: Number of ends down
Figure 6 illustrates that under controlled humidity, end breakages occurred 53 times per spinning frame per shift, whereas this number increased to 248 when the system was off. Higher humidity levels reduce the frequency of yarn breakages because moisture absorption makes the fiber more flexible and less prone to breaking.
5. Conclusion
This study highlights the significant impact of humidity control systems on jute yarn quality, reinforcing the necessity of maintaining optimal environmental conditions in textile manufacturing. The findings demonstrate that a stable humidity level of 67% enhances key quality parameters, including breaking strength, moisture content, and twist per inch (TPI), while significantly reducing end breakages. In contrast, uncontrolled humidity conditions resulted in decreased yarn strength, higher breakages, and inconsistencies in product quality. The system’s ability to maintain consistent fiber integrity and prevent brittleness contributed to higher yarn strength and quality ratio. These results align with previous studies (Chen et al., 2024; Smail et al., 2021), which emphasize the role of humidity regulation in ensuring fiber integrity and improving textile performance. They found that in uncontrolled environments, fluctuations in humidity led to inconsistent yarn strength, whereas in controlled environments with stable humidity (between 60-70% RH), yarn showed consistent quality and improved resilience.
The implications for the jute industry are substantial. Implementing humidity control systems can:
· Reduce material wastage by minimizing defects caused by inconsistent fiber properties.
· Improve machine efficiency by reducing end breakages and ensuring smoother operations.
· Enhance overall product quality, making jute yarn more competitive in the market.
Beyond material benefits, the integration of humidity control systems fosters a more stable and productive work environment, reducing operational disruptions and enhancing overall efficiency. By adopting effective humidity management strategies, textile manufacturers can optimize production processes, improve sustainability, and ensure superior product consistency. This research provides valuable insights for industrial applications and serves as a foundation for future advancements in jute yarn processing and environmental control technologies.
Acknowledgments
The assistance and encouragement provided for our initiative by the authority of Janata Jute Mills Limited, Faridpur is really appreciated.
Declaration of competing interest
The authors declare that they have no known competing financial interests or personal relationships that could have appeared to influence the work reported in this paper.
Funding
This research did not receive any specific grant from funding agencies in the public, commercial, or not-for-profit sectors.
Data availability statement
The authors confirm that the data supporting the findings of this study are available within the article.
References
Alias, A. H., Tahir, P. M., Abdan, K., Salit, M. S., Wahab, M. S., & Saiman, M. P. (2018). Evaluation of kenaf yarn properties as affected by different linear densities for woven fabric laminated composite production. Sains Malaysiana, 47(8), 1853–1860. https://doi.org/10.17576/JSM-2018-4708-25
Aranha, R., Filho, M. A. A., Santos, C. de L., de Andrade, T. H. F., Fonseca, V. M., Rivera, J. L. V., dos Santos, M. A., de Lima, A. G. B., de Amorim, W. F., & de Carvalho, L. H. (2024). Effect of Water Absorption and Stacking Sequences on the Tensile Properties and Damage Mechanisms of Hybrid Polyester/Glass/Jute Composites. Polymers 2024, 16(7), 925. https://doi.org/10.3390/POLYM16070925
Chen, L., Mei, S., Fu, K., & Zhou, J. (2024). Spinning the Future: The Convergence of Nanofiber Technologies and Yarn Fabrication. ACS Nano, 18(24), 15358–15386. https://doi.org/10.1021/acsnano.4c02399
Cole, S. (2024). Is Jute Eco-Friendly / Sustainable? (Pros & Cons Explained). The Roundup. https://theroundup.org/is-jute-eco-friendly-sustainable/
Cottrell, J. A., Ali, M., Tatari, A., & Martinson, D. B. (2023). Effects of Fibre Moisture Content on the Mechanical Properties of Jute Reinforced Compressed Earth Composites. Construction and Building Materials, 373, 130848. https://doi.org/10.1016/J.CONBUILDMAT.2023.130848
Dai, N. ;, Jin, H. ;, Xu, K. ;, Hu, X. ;, Yuan, Y. ;, Shi, W., Dai, N., Jin, H., Xu, K., Hu, X., Yuan, Y., & Shi, W. (2023). Prediction of Cotton Yarn Quality Based on Attention-GRU. Applied Sciences 2023, 13(18), 10003. https://doi.org/10.3390/APP131810003
Dejene, B. K., & Ayele, M. (2024). Impact of Weft Yarn Structure and Fiber Type on Weft Yarn Velocity and Twist Loss in Air-Jet Weaving: A Critical Review. Journal of Natural Fibers, 21(1). https://doi.org/10.1080/15440478.2024.2365961
Gulsevincler, E., Usal, M. R., & Yilmaz, D. (2020). The effect of humidified air on yarn properties in a jet-ring spinning system. Tekstilec, 63(4), 294–304. https://doi.org/10.14502/Tekstilec2020.64.294-304
Islam, M. R., Karim, F. E., & Khan, A. N. (2024). Statistical analysis of Cotton-Jute blended ratio for producing good quality blended yarn. Heliyon, 10(2). https://doi.org/10.1016/j.heliyon.2024.e25027
Paul, T. K., Jalil, T. I., Parvez, M. S., Repon, M. R., Hossain, I., Alim, M. A., Islam, T., & Jalil, M. A. (2022). A Prognostic Based Fuzzy Logic Method to Speculate Yarn Quality Ratio in Jute Spinning Industry. Textiles 2022, 2(3), 422–435. https://doi.org/10.3390/TEXTILES2030023
Practice for Conditioning and Testing Textiles. (2016). ASTM International. https://doi.org/10.1520/D1776_D1776M-16
Samir, A., Ashour, F. H., Hakim, A. A. A., & Bassyouni, M. (2022). Recent advances in biodegradable polymers for sustainable applications. Npj Materials Degradation 2022 6:1, 6(1), 1–28. https://doi.org/10.1038/s41529-022-00277-7
Shahinur, S., Sayeed, M. M. A., Hasan, M., Sayem, A. S. M., Haider, J., & Ura, S. (2022). Current Development and Future Perspective on Natural Jute Fibers and Their Biocomposites. Polymers, 14(7), 1445. https://doi.org/10.3390/polym14071445
Shi, J., Yuan, S., Zhang, W., Wang, G., Zhang, J., Chen, H., & Cheng, H. (2022). Jute yarn-wound composites: Optimization of methods for evaluating mechanical properties and improvement of mechanical properties. Journal of Materials Research and Technology, 21, 827–840. https://doi.org/10.1016/J.JMRT.2022.09.076
Singh, H., Singh, J. I. P., Singh, S., Dhawan, V., & Tiwari, S. K. (2018). A Brief Review of Jute Fibre and Its Composites. Materials Today: Proceedings, 5(14), 28427–28437. https://doi.org/10.1016/J.MATPR.2018.10.129
Smail, Y. Ben, Moumen, A. El, Imad, A., Lmai, F., & Ezahri, M. (2021). Effect of heat treatment on the mechanical properties of jute yarns. Journal of Composite Materials, 55(20), 2777–2792. https://doi.org/10.1177/0021998321999103
Yu, Y., Yang, Y., Tanabe, K., Mastuda, M., & Hamada, H. (2016). Effect of moisture content of jute fabric and hybridization structure on the impact properties of jute and jute/glass hybrid composites. Science and Engineering of Composite Materials, 23(4), 367–374. https://doi.org/10.1515/secm-2013-0147


Georgia Reader Reply
Et rerum totam nisi. Molestiae vel quam dolorum vel voluptatem et et. Est ad aut sapiente quis molestiae est qui cum soluta. Vero aut rerum vel. Rerum quos laboriosam placeat ex qui. Sint qui facilis et.